En savoir plus sur Google Data Studio

Google Data Studio est une solution cloud de reporting conçue pour aider les petites, moyennes et grandes entreprises à personnaliser, partager et visualiser des données via des graphiques et des tableaux configurables. Les fonctionnalités comprennent la collaboration d'équipe, les vues filtrées, la personnalisation de la marque, le suivi de l'utilisation, le contrôle d'accès et la fusion des données. L'application permet aux spécialistes du marketing de collecter des données provenant de différentes sources et de préparer des tableaux de bord et des rapports personnalisés à l'aide d'un éditeur de type glisser-déposer. Les professionnels peuvent ajouter des liens ou des images cliquables aux rapports, générer des catalogues de produits, des bibliothèques vidéo, etc. Avec Google Data Studio, les employés peuvent partager des informations avec les membres de l'équipe, envoyer des invitations pour afficher ou modifier des rapports ou encore intégrer des rapports dans des pages, des blogs et des articles. De plus, les utilisateurs peuvent partager des rapports via des calendriers personnalisés, en joignant un aperçu et un lien vers le rapport complet. Google Data Studio s'intègre à Google Ads, Analytics, BigQuery, Ad Manager, Google Sheets, Attribution 360, Campaign Manager et bien d'autres. Les tarifs sont disponibles sur demande et l'assistance est assurée via une documentation.
Google Data Studio Logiciel - 1
Google Data Studio Logiciel - 2
Google Data Studio Logiciel - 3
Google Data Studio Logiciel - 1 - aperçu
Google Data Studio Logiciel - 2 - aperçu
Google Data Studio Logiciel - 3 - aperçu

Google Data Studio - Prix

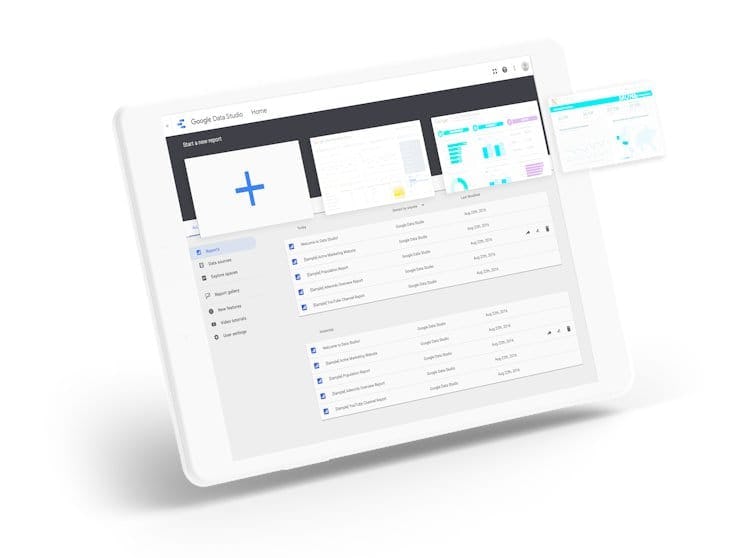
Google Data Studio est disponible en version gratuite.

À partir de :
Non fourni par l'éditeur
Version gratuite :
Oui
Version d'essai gratuite :
Non

Produits similaires à Google Data Studio

Domo

4,3 (322 avis)
Domo est le Business Cloud® qui permet aux entreprises de toutes tailles de tirer parti de la BI (Business Intelligence)...

Adobe Analytics

4,5 (231 avis)
Adobe Analytics est une solution d'analyse du web qui fournit des analyses approfondies, des données d'attribution...

Power BI Connector for Jira

4,5 (21 avis)
Power BI Connector for Jira simplifie l'exportation de données vers Power BI sans compétences utilisateur en code,...

Datorama

4,3 (23 avis)
Datorama by Salesforce est une plateforme de marketing intelligence optimisée par IA (intelligence artificielle) qui...

Kissmetrics

4,1 (19 avis)
Kissmetrics est une solution cloud d'engagement client et d'automatisation des campagnes par e-mail. Il aide les...

Zoho Analytics

4,4 (331 avis)
Zoho Analytics est une solution de reporting et de business intelligence basée sur le cloud qui offre plusieurs...

Pentaho

4,3 (46 avis)
Pentaho est un système de business intelligence conçu pour aider les entreprises à prendre des décisions basées sur les...

Qlik Sense

4,5 (263 avis)
Qlik Sense est une plateforme de BI (Business Intelligence) et d'analytics visuelle qui prend en charge un éventail de...

Luzmo

4,5 (20 avis)
Cumul.io est un outil de création de tableaux de bord qui aide les entreprises à concevoir des tableaux de bord...

Microsoft SQL Server

4,6 (1971 avis)
Microsoft SQL Server Business Intelligence (BI) Edition est une solution logicielle de gestion de base de données et de...

Looker

4,6 (268 avis)
Looker est une plateforme cloud BI (Business Intelligence) conçue pour parcourir et analyser les données. La solution...

AgencyAnalytics

4,8 (114 avis)
AgencyAnalytics est une plateforme cloud de reporting qui permet aux utilisateurs de planifier, créer et personnaliser...

monday.com

4,6 (5441 avis)
monday.com, une plateforme primée de gestion de projet et de collaboration, aide les équipes à planifier et à mettre en...

Trello

4,5 (23434 avis)
Trello est un outil de collaboration visuelle conçu pour la planification de tâches et de projets. Couramment utilisée...

ReportGarden

4,5 (73 avis)
ReportGarden est un outil cloud d'analyse marketing qui offre des rapports marketing configurables et des tableaux de...

Parcourir les avis sur Google Data Studio

326 avis sur 326
Classer par :
Zie Mamadou
Zie Mamadou
  • Secteur d'activité : Logiciels
  • Taille de l'entreprise : 2–10 employés
  • Logiciel utilisé toutes les semaines pendant 1 à 5 mois
  • Provenance de l'avis
Rapport qualité-prix
4
Fonctionnalités
3
Simplicité
4
Support client
4

3
Publié le 18/10/2023

Google Data Studio un outil de visualisation de données

Un outil pour analyser et visualiser les données de petite taille, car limité en terme de fonctionnalités pour des analyses poussées

Avantages

Google Data Studio est un excellent outil pour créer des rapport, de plus il est gratuit donc accessible à tous

Inconvénients

Google Data Studio est limité en langue utilisée

Jory
  • Secteur d'activité : Marketing et publicité
  • Taille de l'entreprise : 201–500 employés
  • Logiciel utilisé tous les jours pendant plus d'un an
  • Provenance de l'avis
Rapport qualité-prix
0
Fonctionnalités
3
Simplicité
4
Support client
0

5
Publié le 05/06/2023

Un outil gratuit et puissant

Avantages

Très bonne expérience dans mon utilisation du Google Data Studio, il est facile de personnaliser des tableaux de bord pour visualiser les données avec un système de drag & drop. L'outil est totalement collaboratif, ce qui est pratique dans le cadre d'un projet en équipe.

Inconvénients

Dommage qu'il n'y ait pas d'assistance en cas de question ou de problème de remontées des données par exemple.

Elise
  • Secteur d'activité : Marketing et publicité
  • Taille de l'entreprise : 11–50 employés
  • Logiciel utilisé tous les mois pendant plus de deux ans
  • Provenance de l'avis
Rapport qualité-prix
0
Fonctionnalités
5
Simplicité
5
Support client
0

5
Publié le 07/07/2023

Clé en main

Avantages

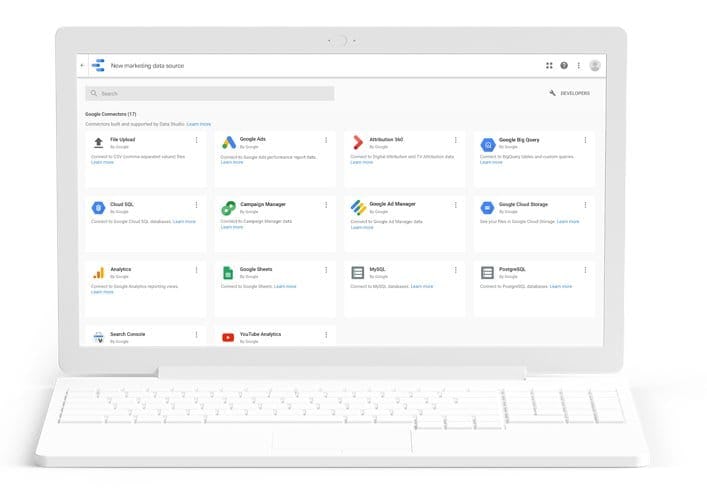
Connexion native avec l'écosystème Google Marketing Platform

Inconvénients

Pas de possibilité de personnaliser certains items

Estelle
  • Secteur d'activité : Santé, bien-être et fitness
  • Taille de l'entreprise : 1 001–5 000 employés
  • Logiciel utilisé toutes les semaines pendant plus de deux ans
  • Provenance de l'avis
Rapport qualité-prix
5
Fonctionnalités
4
Simplicité
3
Support client
0

5
Publié le 10/04/2023

Indispensable !

Très bonne

Avantages

Outil qui a changé ma vision des reportings. J'ai configuré les chiffres à mettre en avant et désormais je n'ai plus qu'à changer la plage de dates pour que les chiffres se mettent à jour (au lieu de les mettre à jour à la main un par un chaque mois...).

Inconvénients

Cette solution peut être assez technique à mettre en place, les add ons gratuits afin de lier des sources de données de type réseaux sociaux ne sont pas très nombreux.

Nicolas
  • Secteur d'activité : Banque
  • Taille de l'entreprise : 10 000+ employés
  • Logiciel utilisé tous les jours pendant plus de deux ans
  • Provenance de l'avis
Rapport qualité-prix
5
Fonctionnalités
5
Simplicité
5
Support client
2

5
Publié le 23/02/2023

Gratuit et performant

Avantages

C'est une des solutions idéales pour la création de dashboards, car entièrement basée sur le cloud et bien intégrée à l'environnement Google. Le système permet de créer facilement des tableaux de bord à partir de plusieurs sources.

Inconvénients

L'un des principaux inconvénients de l'utilisation de Google Sheets pour la création de tableaux de bord est le manque d'assistance. Lorsque les choses tournent mal, vous êtes seul et vous n'aurez personne à qui demander de l'aide. Bien qu'il s'agisse d'un outil puissant pour organiser et analyser des données, ce n'est pas aussi robuste que d'autres outils. Par exemple, il manque des options de data visualisation, des fonctions interactives et des mises à jour de données en temps réel.

Hugo
Hugo
  • Secteur d'activité : Marketing et publicité
  • Taille de l'entreprise : 1 001–5 000 employés
  • Logiciel utilisé tous les jours pendant plus de deux ans
  • Provenance de l'avis
Rapport qualité-prix
0
Fonctionnalités
5
Simplicité
4
Support client
3

4
Publié le 13/01/2023

L'outil référence de Data Visualisation

Avantages

Les fonctionnalités ayant le plus d'impact sont les connecteurs natifs avec les différentes solutions Google. Que l'on souhaite connecter Google Analytics ou bien BigQuery pour plus de données, tout est assez simple. Le principe de drag and drop et le nombre de personnalisations possibles rende l'outil très efficace

Inconvénients

Appartenant à Google, nous pouvons regretter la mise en place des quotas d'appels à l'API Google Analytics 4 qui limite l'utilisation des dashboards. Les connecteurs de la communautés sont payants pour la plupart. Enfin, on peut vite se perdre dans l'interface via les trois menus de personnalisation

Utilisateur vérifié
  • Secteur d'activité : Marketing et publicité
  • Taille de l'entreprise : 51–200 employés
  • Logiciel utilisé tous les jours pendant plus de deux ans
  • Provenance de l'avis
Rapport qualité-prix
0
Fonctionnalités
4
Simplicité
4
Support client
0

5
Publié le 30/01/2023

Idéal pour suivre les performances SEO d'un site web

Avantages

L'outil permet d'agréger toutes sortes de données pour le SEO comme la search console ou semrush.

Inconvénients

Il y a une limitation dans les quotas de données pour certaines sources comme Google Analytics obligeant à passer par une solution intermédiaire comme BigQuery.

Utilisateur vérifié
  • Secteur d'activité : Développement et commerce international
  • Taille de l'entreprise : 201–500 employés
  • Logiciel utilisé toutes les semaines pendant plus de deux ans
  • Provenance de l'avis
Rapport qualité-prix
0
Fonctionnalités
5
Simplicité
5
Support client
0

4
Publié le 03/01/2023

Très simple d'utilisation

Avantages

C'est un logiciel de drag and drop très simple à utiliser.

Inconvénients

Il est si simple qu'il autorise parfois quelques non-sens comme l'utilisation combinée de métriques et dimensions qui ne devraient pas être utilisées ensembles.

Filippo
Filippo
  • Secteur d'activité : Services et technologies de l'information
  • Taille de l'entreprise : 5 001–10 000 employés
  • Logiciel utilisé toutes les semaines pendant 6 à 12 mois
  • Provenance de l'avis
Rapport qualité-prix
5
Fonctionnalités
5
Simplicité
4
Support client
5

5
Publié le 24/01/2024

Changed the way I can access and build report!

My experience is extremely positive, and adopting GDS has been beneficial both at the individual and team level. It allows more flexibility in building and accessing our reports, and the visual dashboards allowed us to share insights without transforming the data in other softwares, greatly simplifying our workflow.

Avantages

As an end user accessing Google Data Studio to review performance reports, what I like most is the ability to consolidate different reports in a visually compelling dashboard. The easy to use interface allows to quickly navigate reports and get at-a-glance insights on relevant KPIs and monitor trends.

Inconvénients

Adapting to Google Data Studio has been a learning curve, especially coming from previous reporting software. Interface is clear, but to customize it in order to fits my needs took longer than I expected. Collaborative aspects are beneficial, there was an adjustment period in coordinating with team members who were also learning the platform.

Matthew
  • Secteur d'activité : Logiciels
  • Taille de l'entreprise : Auto-entrepreneur
  • Logiciel utilisé toutes les semaines pendant 1 à 5 mois
  • Provenance de l'avis
Rapport qualité-prix
4
Fonctionnalités
5
Simplicité
4
Support client
5

5
Publié le 25/09/2024

Google Data Studio for an AI Focused Agency: Review

For an AI agency, Data Studio was very useful since it enabled us to come up with actionable reports and dashboards from multiple data sources. Except for a few difficulties, the simplicity of using the platform as well as its visualization options proved its worth.

Avantages

Thanks to the drag-and-drop features of Google Data Studio, we were able to generate meaningful charts and graphs for many of the ideas that we had regarding various AI projects in a very short time.

The platform provided a lot of data source connections which helped us to evaluate performance and measure KPIs.

Inconvénients

Some advanced aspects like calculated fields were quite difficult to grasp at first, which made us a bit slower than optimal.

Alternatives envisagées 

Tableau et Microsoft Power BI

Pourquoi passer à Google Data Studio

The drag-and-drop functionality of Data Studio and its comparatively easier learning curve, ensured technical and non-technical could use it. Ease of use of data insights facilitated a data use culture where many more people can access data and analyze it for useful insights.
Camille
  • Secteur d'activité : Compagnies aériennes/Aéronautique
  • Taille de l'entreprise : 51–200 employés
  • Logiciel utilisé toutes les semaines pendant plus d'un an
  • Provenance de l'avis
Rapport qualité-prix
0
Fonctionnalités
3
Simplicité
2
Support client
0

3
Publié le 28/03/2024

Tool to have a big picture of performances

Avantages

It's a good tool to link different databases and create tables and graphs. We can play on data and create proper dashboards.

Inconvénients

It's sometimes hard to mixed the datas and get the view we had in mind. Representing deep level of campaign is hard.

Autumn
  • Secteur d'activité : Construction
  • Taille de l'entreprise : 11–50 employés
  • Logiciel utilisé toutes les semaines pendant 1 à 5 mois
  • Provenance de l'avis
Rapport qualité-prix
3
Fonctionnalités
4
Simplicité
3
Support client
4

4
Publié le 12/12/2024

Great for interactive dashboards

Okay software. Decent for dashboards where there needs to be interaction

Avantages

Free and easy to use. Integrates with other google software

Inconvénients

Not as advanced as some other softwares so it doesn’t allow real time updates

Kevin
Kevin
  • Secteur d'activité : Marketing et publicité
  • Taille de l'entreprise : 11–50 employés
  • Logiciel utilisé toutes les semaines pendant plus de deux ans
  • Provenance de l'avis
Rapport qualité-prix
5
Fonctionnalités
4
Simplicité
4
Support client
0

4
Publié le 30/07/2023

Swiss Army Knife for Basic Data Visualization

Overall this is useful data visualization tool that meets most organizational/departmental needs.

Avantages

Price for entry level reporting is free. Hard to beat that. There is a growth path for data platform connectivity should your needs expand over time.

Inconvénients

More sophisticated calculations (KPIs for example) can be challenging to execute.As a cloud-based tool, the interface can be slow during some time periods.Reporting can be slow to load.

Alternatives envisagées 

Visme et Tableau

Pourquoi passer à Google Data Studio

Lower cost, Google centric data sources. Ease of use for users.
Kevin
  • Secteur d'activité : Internet
  • Taille de l'entreprise : 11–50 employés
  • Logiciel utilisé tous les jours pendant plus de deux ans
  • Provenance de l'avis
Rapport qualité-prix
5
Fonctionnalités
5
Simplicité
5
Support client
5

5
Publié le 09/11/2023

Easy to use

Avantages

Easy to connect spreadsheets to do quick data analysis if you are a beginner in data analysis. It's also a very good tool if you're more experienced and need to do more advanced reporting.

Inconvénients

Sometimes it can be slow. Some report fail and it's not always easy to know what is failing.

Belal
  • Secteur d'activité : Marketing et publicité
  • Taille de l'entreprise : Auto-entrepreneur
  • Logiciel utilisé tous les jours pendant plus de deux ans
  • Provenance de l'avis
Rapport qualité-prix
5
Fonctionnalités
4
Simplicité
5
Support client
3

5
Publié le 19/07/2023

Love the flexibility

I've been using it for over 5 years and have tried other tools however it's always been my go to.

Avantages

I love the flexibility that Google Data Studio provides. Most other data visualisation tools are very structured while data Studio is flexible which makes it great for aesthetically designing the dashboard. It allows me to easily create dashboard for my stakeholders as well as small business owners who can become data driven.

Inconvénients

Slow, GA4 connector, paid connectors, there's no good user journey visualisation and now there seems to be some limitations of the number of charts I can add.

Alternatives envisagées 

Tableau

Pourquoi choisir Google Data Studio 

Qlik Sense was not easy to use while Data Studio was very flexible and easy to use.

Logiciel antérieur 

Qlik Sense

Pourquoi passer à Google Data Studio

It's free works better with Google products such as search console and GA4
Hany
  • Secteur d'activité : Enseignement supérieur
  • Taille de l'entreprise : 11–50 employés
  • Logiciel utilisé toutes les semaines pendant plus de deux ans
  • Provenance de l'avis
Rapport qualité-prix
5
Fonctionnalités
5
Simplicité
5
Support client
5

5
Publié le 29/04/2023

Easy to use Data Analysis Application

Google Looker Studio ( formerly Google Data Studio ) allows my team members to access and create analytical reports and share them with stakeholders and teammates. It helps my team visualize performance reports and run simple ad-hoc analyses. The service enhances our productivity and improves the information workflow internally over the company and externally with our clients.

Avantages

Google Looker Studio ( formerly Google Data Studio ) is easy to use and has an intuitive user interface that allows the average user to create and consume reports and dashboards. It integrates seamlessly with google analytics and workspace applications like Sheets, docs, and Google Drive. It facilitates self-service data analysis and business intelligence practices.

Inconvénients

Google Looker Studio ( formerly Google Data Studio ) has a relatively slow performance and limited features regarding data connectors and visualization. Although the paid version has advanced features, it comes at a high cost with more difficulties and barriers to scale.

Alternatives envisagées 

Tableau

Pourquoi passer à Google Data Studio

The service suits our small-sized data workflows and is considered one of the easiest-to-use business intelligence applications. It's quick to start and requires minimal training for new users as long as we use it on a limited scale.
Utilisateur vérifié
  • Secteur d'activité : Marketing et publicité
  • Taille de l'entreprise : 11–50 employés
  • Logiciel utilisé tous les jours pendant plus de deux ans
  • Provenance de l'avis
Rapport qualité-prix
5
Fonctionnalités
5
Simplicité
4
Support client
3

5
Publié le 12/06/2023

The best review software our agency has ever used!

Overall, we are very pleased with Google Data Studio. Obviously, the platform itself is inexpensive and easy to use, but the connectors do add up to be somewhat pricy. It is very functional and is so helpful in terms of creating live dashboards to send to clients. Also great for internal reporting to make sure we are keeping up with client performance throughout the month.

Avantages

The most highly appreciated feature of Google Data Studio is the ability to integrate multiple data sources in one report.

Inconvénients

Recently Google Data Studio seems to be having a lot of glitches. The charts will randomly be missing or the data will no longer be connected.

Alternatives envisagées 

ReportGarden

Pourquoi choisir Google Data Studio 

There wasn't enough customization with Databox.

Logiciel antérieur 

Databox
Mariia
Mariia
  • Secteur d'activité : Internet
  • Taille de l'entreprise : Auto-entrepreneur
  • Logiciel utilisé tous les jours pendant plus d'un an
  • Provenance de l'avis
Rapport qualité-prix
5
Fonctionnalités
5
Simplicité
5
Support client
5

5
Publié le 11/08/2024

Visualization is an aid to data-driven product decision making

I use this tool to build product reports and to analyze users. I make both general dashboards and reports in which I can analyze each user separately.

Avantages

Ability to create any type of data visualization that will help you work on your product strategy. These reports are also useful when presenting a quarterly report

Inconvénients

Sometimes there are problems with using Google Sheets as a data source

Alternatives envisagées 

Tableau

Pourquoi passer à Google Data Studio

Because of the user-friendly interface..
Siim
  • Secteur d'activité : Services aux consommateurs
  • Taille de l'entreprise : 11–50 employés
  • Logiciel utilisé tous les mois pendant plus d'un an
  • Provenance de l'avis
Rapport qualité-prix
5
Fonctionnalités
3
Simplicité
2
Support client
2

5
Publié le 01/06/2023

Great starter for creating dashboards

Avantages

I like how easy it was to pull data from all Google native channels like ads and analytics. Using some tutorial, you can create custom dashboards according to your need. Best is that its free.

Inconvénients

Getting data from not google native sources was impossible for me. I didn't manage to set it up. Initial deployment requires some googling or otherwise you wont figure it out.

Natalia
  • Secteur d'activité : Production alimentaire
  • Taille de l'entreprise : 1 001–5 000 employés
  • Logiciel utilisé tous les jours pendant 6 à 12 mois
  • Provenance de l'avis
Rapport qualité-prix
5
Fonctionnalités
4
Simplicité
5
Support client
4

5
Publié le 06/10/2021

Our experience using GDS

We have a lot of employees, and we cannot give them all payed users of a software to visualize our indicators and processes results. When we test the software for the first time, we cannot imagine all the possibilities for free that we had in front of us. We had a very fast learning curve, and it was only a matter of months before various departments were already implementing their own dashboards. We love that we can edit several people on the same dashboard without problems.

Avantages

To have a tool that give to you the opportunity to develop a complete dashboard is amazing, and the fact that that tool is free, is awesome.
I really enjoy that GDS is really easy to use, I learn by myself and seeking videos on the internet. It is a very intuitive application, so you might not know anything about data visualization and you could still use it without problem.
I really like that the Google apps have very similar edit pages, so if you have ever used Google Forms, you are going to find GDS very familiar.

Inconvénients

I find this software very useful, but there is one thing that I want they to improve, if there is the possibility. The connection with Microsoft Office, for example: Microsoft Excel. If you want to make a dashboard on GDS, you have to pass your data to google sheets, and you lost a lot of features that Excel gives to you. There is a way to do it by using python, but, if you want to preserve the fact that this software is really easy to use, so, it is not a solution to this problem.

Alternatives envisagées 

Microsoft Power BI

Pourquoi passer à Google Data Studio

We are using both of them, but we choose Data Studio becaus eit is userfriendly, it is very intuitive, and it is free.
Brent
  • Secteur d'activité : Production audiovisuelle
  • Taille de l'entreprise : Auto-entrepreneur
  • Logiciel utilisé toutes les semaines pendant plus de deux ans
  • Provenance de l'avis
Rapport qualité-prix
5
Fonctionnalités
5
Simplicité
3
Support client
0

5
Publié le 07/06/2022

Reporting that is powerful enough for most, and affordable for all

Data Studio has really improved over the last year or two. It's much more stable than it used to be, and is more in depth. As a small agency, I haven't found much that is missing.

Outside of setting up integrations and data sources and then creating the dashboard connections, the rest is fairly simple to set up. Customizing a dashboard is easy, and sorting data is easy once you do a couple and learn the dimensions of how data is displayed.

Having a free dashboard and reporting tool that integrates directly with other Google products is awesome.

Avantages

I love that it's a tool directly from the same company where I get most of my data already. I use Google Analytics and Google Ads heavily in my business, so it's awesome to have a data analysis and reporting tool that has stable connections to both of these. Being able to integrate both, and other integrations into the same dashboard is a big plus.

And the depth of features has really gotten pretty large over the last couple of years. Unless you need extremely advanced calculations and reporting, Data Studio will probably suit your needs. The ability to sort your data and fine-tune exactly how metrics are displayed is cool.

It doesn't hurt that Data Studio is free! These kinds of tools are often very expensive, but Data Studio allows smaller studios like mine to get in the game for little to no investment.

Inconvénients

It's a bit of a pain to get set up, and to fully integrate. The documentation, while large, is not easy to follow in my opinion.

Adding a data source and then creating a dashboard using a specific source can be a little hit and miss. It shouldn't take 3 or 4 screens of options to tell my dashboard that I want to get data from a specific source. Once you get past it, it's fine. But setting up a new dashboard, and organizing dashboards, is cumbersome.

Alternatives envisagées 

Zoho Analytics

Pourquoi passer à Google Data Studio

Data Studio is free. Zoho Analytics is more robust overall, but also comes with a higher cost, and a higher learning curve.
Utilisateur vérifié
  • Secteur d'activité : Logistique et chaîne d'approvisionnement
  • Taille de l'entreprise : 201–500 employés
  • Logiciel utilisé tous les jours pendant plus de deux ans
  • Provenance de l'avis
Rapport qualité-prix
5
Fonctionnalités
3
Simplicité
3
Support client
0

4
Publié le 06/06/2022

A little clunky to use but improving very rapidly as a BI tool

Overall, despite its challenging user experience, it's still a great tool. The quality of the reports and charts are topnotch. For a free BI tool, it's a good value for our money

Avantages

I like that it's basically free and it's easy to create good-looking reports and share them with your colleagues. We're able to basically have another BI tool at our disposal without going through a lengthy procurement and deployment process.

Inconvénients

Connecting a database is quite challenging with Google Data Studio. The error messages are not very helpful at its current state. And sometimes it gives you random errors for no clear reason.

JS
  • Secteur d'activité : Biens de consommation
  • Taille de l'entreprise : 2–10 employés
  • Logiciel utilisé tous les jours pendant 1 à 5 mois
  • Provenance de l'avis
Rapport qualité-prix
5
Fonctionnalités
5
Simplicité
4
Support client
3

5
Publié le 13/07/2021

BEST Data Visualization Tool

Data Studio is an incredible tool! It is intuitive to use and I prefer it to other data visualization software on the market.

Avantages

Data Studio integrates seamlessly into the Google App Suite which happen to integrate with most platforms itself.

Inconvénients

A lot of the data connection functionality comes from apps that have premium features that you have to pay for.

Alternatives envisagées 

Tableau et Microsoft Power BI

Pourquoi choisir Google Data Studio 

We opted to use Google for our business software needs and Data Studio integrates seamlessly.

Logiciel antérieur 

Microsoft Power BI

Pourquoi passer à Google Data Studio

Google has built products that integrate across nearly all platforms. Having a data tool built on Google's universality makes it easy to build an actual dashboard instead of focusing on the data itself.
Andres
  • Secteur d'activité : Services aux consommateurs
  • Taille de l'entreprise : 10 000+ employés
  • Logiciel utilisé toutes les semaines pendant plus d'un an
  • Provenance de l'avis
Rapport qualité-prix
0
Fonctionnalités
5
Simplicité
5
Support client
5

5
Publié le 19/11/2023

My opinion

Avantages

easy for use, its stability and performance for me is the best on the market

Jakub
  • Secteur d'activité : Marketing et publicité
  • Taille de l'entreprise : 11–50 employés
  • Logiciel utilisé tous les mois pendant plus de deux ans
  • Provenance de l'avis
Rapport qualité-prix
0
Fonctionnalités
5
Simplicité
3
Support client
0

5
Publié le 02/10/2023

An essential tool for SEO work

Avantages

combining data from different tools in a single sheet.

Inconvénients

Sometimes paid connectors for Google services such as GMB have to be used

326 avis

Catégories connexes